
Your equipment speaks. We empower you to listen.TM
XOi captures what’s happening in the field, fills in what’s missing, and connects it to your systems so every asset tells a complete story.
What is XOi?
With the right information, you can make more informed decisions that grow revenue, reduce costs, and increase uptime.


For teams that rely on accurate equipment data
Whether you install, manage, maintain, or make decisions about equipment, XOi gives you a shared understanding of every asset.


Built alongside the people doing the work
XOi was built to solve real problems on the jobsite. Every workflow, every data point, and every insight comes from real work technicians are doing in the field, not assumptions. This foundation makes XOi data and AI tools more accurate, complete, and usable across your business.
Connecting field work to the decisions that follow
Across site surveys, service, quoting, and planning, each interaction builds a clearer understanding of every asset.
Jobsite management
Jobsite management
Guide techs through every job
Simple workflows, a built-in knowledge base, and the right context help technicians work consistently, with clear AI job summaries generated after every visit.

Site surveys & inspections
Site surveys & inspections
See a complete view of every asset
Capture equipment conditions and create a complete, reliable record, with AI structuring the information automatically.

Insights & recommendations
Insights & recommendations
Know what needs attention next
Get a clear view across your asset portfolio so you see what needs to be done, prioritize work, and stay ahead of issues.

Quoting & planning
Quoting & planning
Quote and plan with a complete view of the asset
Use complete equipment information to scope the job, plan the work, and price it accurately with clear, customer-ready proof.

Data APIs
Data APIs
Connect every system to the same equipment data
Deliver structured, enriched asset data across your systems so every team works from the same, consistent view.

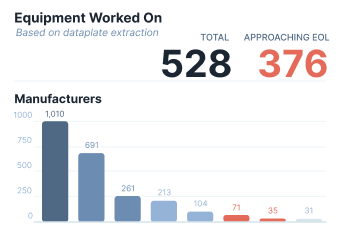
The most complete asset data foundation in field service
Most equipment data is incomplete, inconsistent, or hard to use. Critical details like configuration, lifecycle, and refrigerant are buried in model codes, scattered across documents, or locked in systems. XOi brings that data together in a complete, structured view your teams can actually use.

Unique models across 150+ manufacturers, enriched with 100+ asset-level attributes
Manuals, diagrams, and technical resources available
Jobs completed, creating real-world performance data and benchmarking
Customer proof
Real outcomes from teams who trust XOi.

Built to work with your existing systems
XOi integrates with the systems your team already uses, bringing your equipment data together.


Resources
Podcasts, eBooks, webinars and more to help you master asset intelligence.


.jpg)
.avif)


.webp)


Put your equipment data to work
Capture better data, align your teams, and get the clarity you need to act.